|
|
|
|
|
|
Transmission lines and testing at operating frequency – VNA v TDR
Application Note AP155
|
|
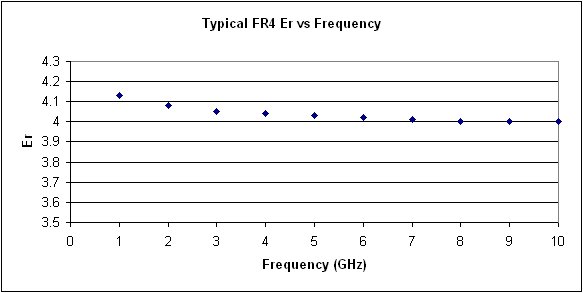
Transmission lines and testing at operating frequency – should a VNA give results similar to a TDR? Sometimes board fabricators are asked to test PCB transmission lines at a given frequency. In some cases boards are tested using a Vector Network Analyser (VNA) and in others a Time Domain Reflectometer (TDR); both instruments should offer similar readings. This note sets out to explain expected difference in measurement results, and should also point out where differences are due to incorrect test setup rather than any material problem How do PCB transmission lines (controlled impedance traces) behave at different operating frequencies ? The elegance of the transmission line is that in the ideal world its behaviour is independent of frequency. Designers use transmission lines to deliver high speed signals with minimum degradation. This is the ideal condition; however, in the real world you may see some minor differences as the operating frequency changes. The key word here is minor changes. The primary physical characteristic that causes PCB transmission lines to deviate from the ideal is the dielectric constant, Er, of the base material. However, as the following graphs show, by modelling a typical transmission line on FR4 from 1 to 5GHz the effect of dielectric constant change is minimal in impedance terms. Will different measurement techniques yield different results ? Measure the modeled line with a TDR and you will be able to see the actual impedance, you may also note that the impedance measured does not change with TDR risetime, primarily because TDR measurements are composed of a band of measurement frequencies, of which the high frequency content is a relatively small proportion. Measure the line with a VNA and the line impedance should also correlate with the TDR; at most the deviation should only be a few ohms from the TDR measurement. You can refer back to the predicted impedance to see why. VNAs are precision RF instruments; however they are more difficult to set up than the TDR and the measurement technique is very sensitive to interconnect. In some instances, we have heard claims that a transmission line measured on a VNA is 20 to 30 Ohms different from the same line measured on a TDR. This should never happen; the error is most likely to result either from poor high frequency interconnect to the DUT or a resonance situation. The measurement of Zo can prove difficult, even with a VNA. For example, the connectors at both ends of the line must be characterised for each trace configuration. The VNA requires considerable expertise if misleading readings are to be avoided. The graph below shows typical variations in the Er of FR4 with frequency. Er varies from about 4.15 down to around 4 at 5Ghz and remains essentially flat above 5Ghz (actual figures depend on glass-resin ratios).
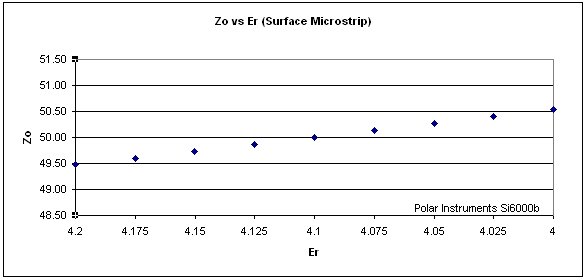
From the graph of a Zo vs Er for a surface microstrip structure below you can see the modelled change in impedance is very small (approximately 1 Ohm for a nominal 50 Ohm Zo) over the range of Er from 4 to 4.2.
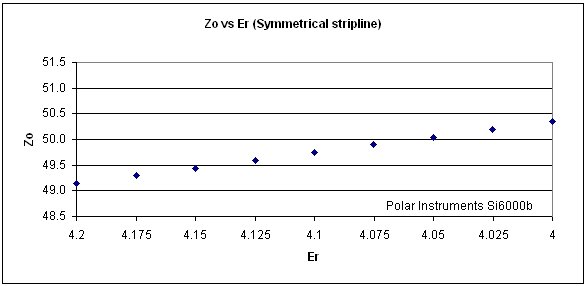
The effects are similar for a symmetrical stripline structure (below).
How do I correlate the measurements? First, by modelling the line with a field solver you will obtain a "laws of physics" understanding of the nominal impedance of your controlled impedance transmission line. Second, you should verify your impedance test system or lab TDR is accurate against a traceable impedance standard. You may also like to note that the measured impedance of the reference line does not alter with TDR pulse risetime. Third, the VNA should also be verified against standard impedance samples. When using a VNA, remember that if you see a significant change in measured impedance with frequency, i.e. for a 20 Ohm change over a frequency range of 1GHz the change is very likely to be setup rather than transmission line related. Again, refer back to the field solver and material characteristics to reassure yourself of the predicted values. |