|
|
|
|
|
|
Impedance variation with frequency can be counter intuitive
Application Note AP8190
|
|
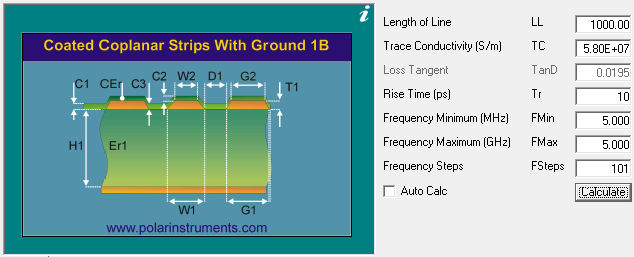
Transmission line impedance Transmission line impedance is broadly constant over a wide range of frequencies – however impedance on a uniform transmission line is derived from:
(where L and C are inductance and capacitance per unit length of line respectively) and as the dielectric constant tends to fall slightly with increasing frequency you would anticipate that Z0 would increase as you sweep through the frequency range. A quick calculation with a range of frequencies in the Si9000e transmission line field solver shows this is not the case. This application note explains why… Graphing Zo against frequency with the Si9000e The Si9000e supports single or multiple dielectric builds in a comprehensive range of trace and dielectric configurations. Graphing against frequency is provided for impedance magnitude, loss (conductor loss, dielectric loss and insertion loss), inductance, capacitance, resistance, conductance and skin depth.
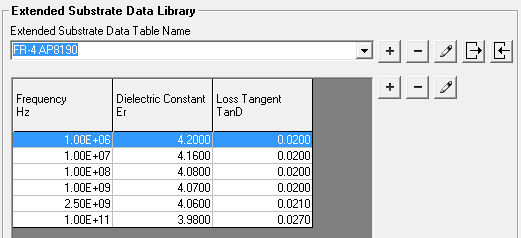
Frequency-dependent calculations The Si9000e frequency-dependent calculations can be refined using extended substrate data. For example, you can assign substrate values by frequency band to accommodate material from manufacturers who specify parameters, such as Er and loss tangent, that vary by frequency. Using the Extended Substrate Data option the Si9000e can accept tables of multiple values of dielectric constant and loss tangent (or use a single value to enable Svensson-Djordjevic frequency dependent permittivity modelling.) Use the Extended Substrate Data table Edit function to add or modify tables describing the frequency-dependent behavior of substrate material. In the table below, for example, Er and Loss Tangent are defined for the frequencies of interest; for this material Er decreases with frequency.
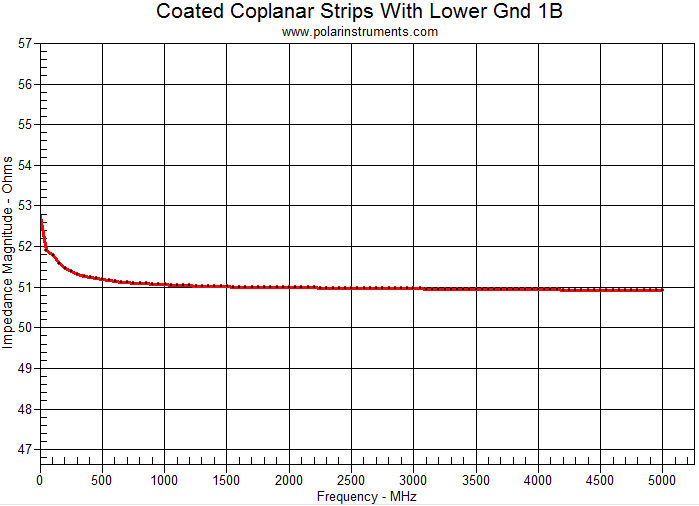
At first glance, however, the results may be slightly surprising. You might expect that as Er decreases with frequency the impedance should rise as the frequency increases. Graphing Z0 against frequency in the Si9000e, though, it can be seen that as the Er decreases the impedance also decreases. Note from the Si9000e graph below the fall of Z0 with rising frequency:
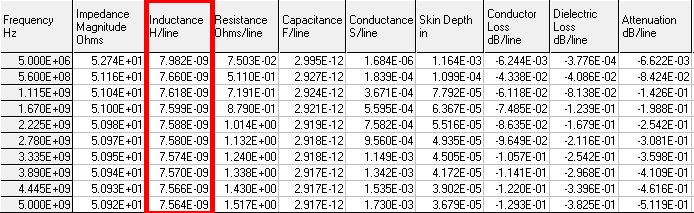
However, more is happening than just the Er changing as the frequency sweeps! Displaying the table of underlying values (the Single Ended tab) shows that the solver is also solving the inductance.
The Inductance column shows that at the lower frequency end the inductance is changing as indicated above – and as Er only has a square root effect on the capacitance the inductance has the dominant effect on Z0 at the lower frequencies. The inductance, L, depends on the skin depth. L decreases with skin depth, which in turn decreases with frequency. Once the skin effect is fully developed the inductance changes are minimal and at the higher frequencies Er will have more predominant effect. However, as the frequency rises the change in Er also slows down. So the Z0 reduction you see as the frequency rises to fully develop the skin effect is expected behaviour. |