

Charting Z0 as H1 and H2 vary
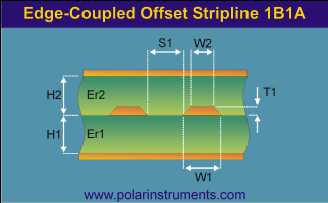
For this example, choose an edge coupled stripline and chart the variation in Z0 as the two substate heights are varied. Choose the structure Edge-Coupled Offset Stripline 1B1A

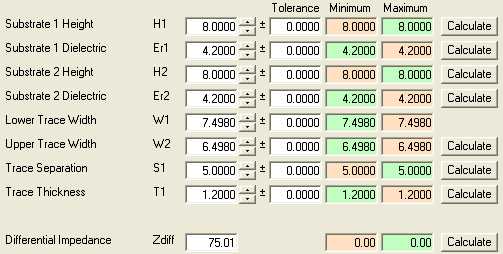
Enter the parameters below and goal seek on trace width for a differential impedance of 75 Ohms.

Note the nominal value for both H1 and H2 of 8 mil.
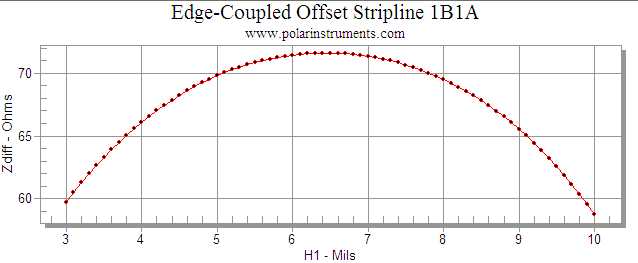
Switch to the Sensitivity Analysis tab and specify the parameters below – in this example vary both H1 and H2: increment H1 between 3 and 10 with an interval between increments of +0.1 mil, set the value of H2 to decrement by the same interval (–0.1 mil)

Click Calculate – the result is shown below


